Blog
🏛️ University
26th March 2021
Where Did International Student Applicants to the USA Come From in 2021?

Subscribe
Get exclusive international student recruitment insights delivered straight to your inbox
As colleges and universities across the USA begin to report on applications in the 2020/21 cycle, we’re getting the first glimpse of what a post-COVID admissions landscape could look like.
For our latest report, we measured the number of students who submitted applications to one or more US institutions through the BridgeU platform and examined how applications trends changed year on year between 2020 and 2021. To do this, we calculated the percentage change between the number of students who applied to US institutions in 2020 and the number of students who applied to US institutions in 2021.
In creating this report, we divided our findings into a number of broad categories.
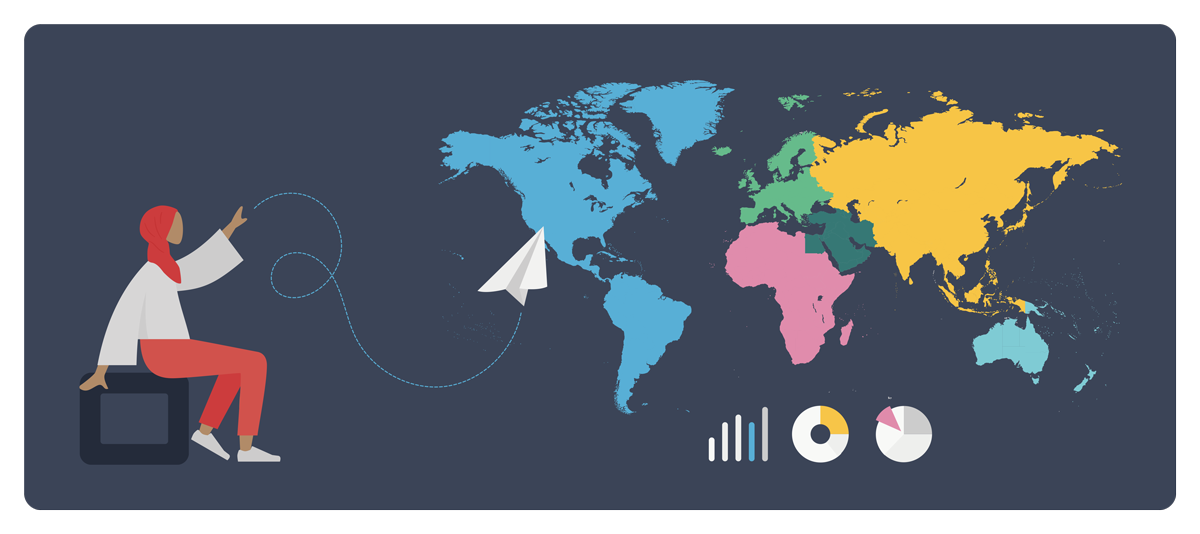
In this, the first in a series of posts summarising the findings of our report, we’ll provide you with a quick overview of the data in our first section – how international applications to the USA changed by students’ region, country and city of origin.
To provide you with a digestible summary of these findings, we’ve collated them into a short infographic. So what did our latest research uncover?
If you read our earlier report, where we looked into how international students’ interest in the USA had changed year on year (based on our analysis of students’ shortlists in the BridgeU platform), then you might remember that the USA experienced a year on year decrease in interest from international students in most of the major regions of the world.
Fast forward two months and our analysis of BridgeU students’ eventual applications paint an almost identical picture. The USA saw a year on year decrease in applications from every region of the world, except for one…
The only region to defy the overall global trend was Europe, where there was a small increase of 4.25% in applications.
We could hypothesise that the UK’s departure from the EU may partially explain the increase in interest in the USA. With Brexit meaning continental European students now face higher tuition fees, more European students may now be looking at the USA as a viable option.
If the USA is reaping the benefits of a ‘Brexit bounce’, it remains to be seen if this becomes a long-term trend in future application cycles.
Schools in Asia reported the highest number of applications per student, while the Americas saw the largest overall increase in applications per student.

Those countries with the largest single year on year increases were, in the Americas, Venezuela (156%) and the Cayman Islands (108%), and, in Africa, Nigeria (100%).
While the USA saw an increase in interest across Europe in general, there were three countries that bucked the trend – Germany, Spain and Luxembourg.
The most populated cities across our high schools in 120 countries tell a slightly different story. Asia had the highest concentration of cities where interest in the USA increased.
Specifically, Jaipur and Hyderabad were the Indian cities that saw the biggest growth. In Bangladesh, Dhaka was the Asian city with the highest single year on year increase (63%).
Meanwhile, in Europe, Budapest (Hungary) and Milan (Italy) were the two cities that saw the highest year on year growth, at 47% and 63% respectively.
These are just a few of the findings from our latest research. But if you work in college admissions and you specialise in international recruitment, you might be reading this and asking the question, ‘what does this mean for me and my institution?
To talk through our findings in more detail, join our University Partnerships Manager for a series of three webinars between now and the end of April. We’ll discuss the findings of our report in more detail and look at what these findings could mean for the future of international student admissions across the United States. Our first instalment will take place on 31st March at 12:00pm Eastern Time.
Learn how BridgeU can help you align your enrolment strategy with your international student audience.